ArcGIS相关性分析
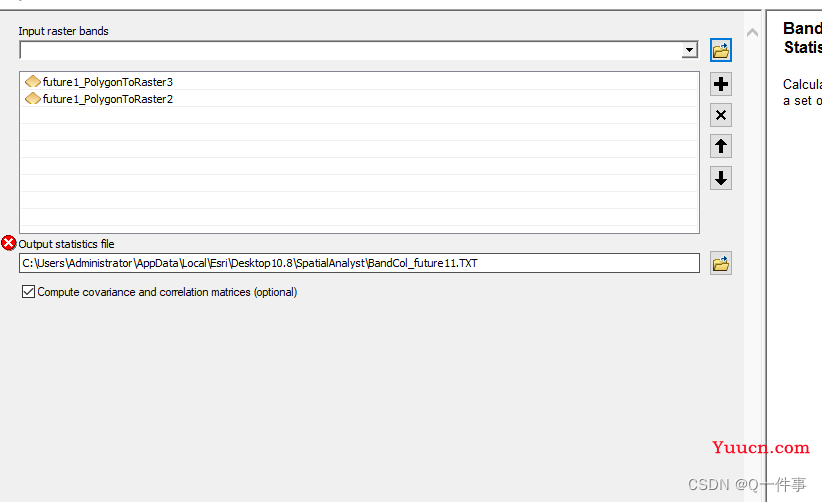
Spatial Analyst Tools——Multivariate(多元分析)——Band Collection Statistics(波段集统计)。
添加图层,勾选Compute covariance and correlation matrices以输出相关第分析结果,结果保存成txt。
使用的是皮尔逊相关系数(Pearson Correlation Coefficient)。
Spatial Analyst Tools——Multivariate——Band Collection Statistics
添加图层,勾选Compute covariance and correlation matrices以输出相关第分析结果,结果保存成txt。
使用的是皮尔逊相关系数(Pearson Correlation Coefficient)
数据的解释
arcgis10.8的结果
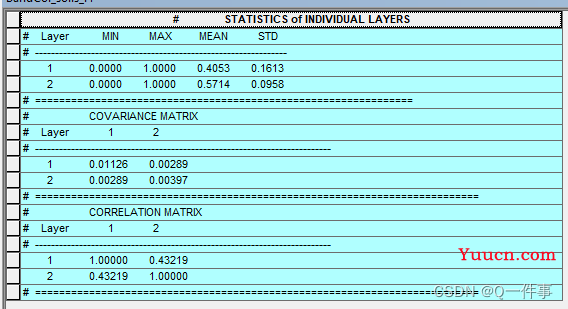
arcgis pro的结果
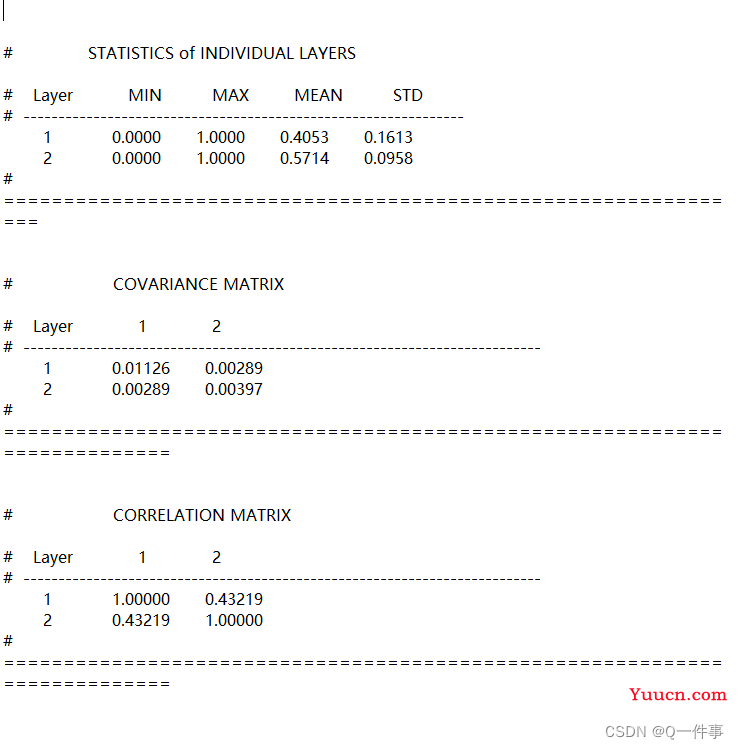
从这里可以知道无论是ArcGIS还是pro都是一样的。
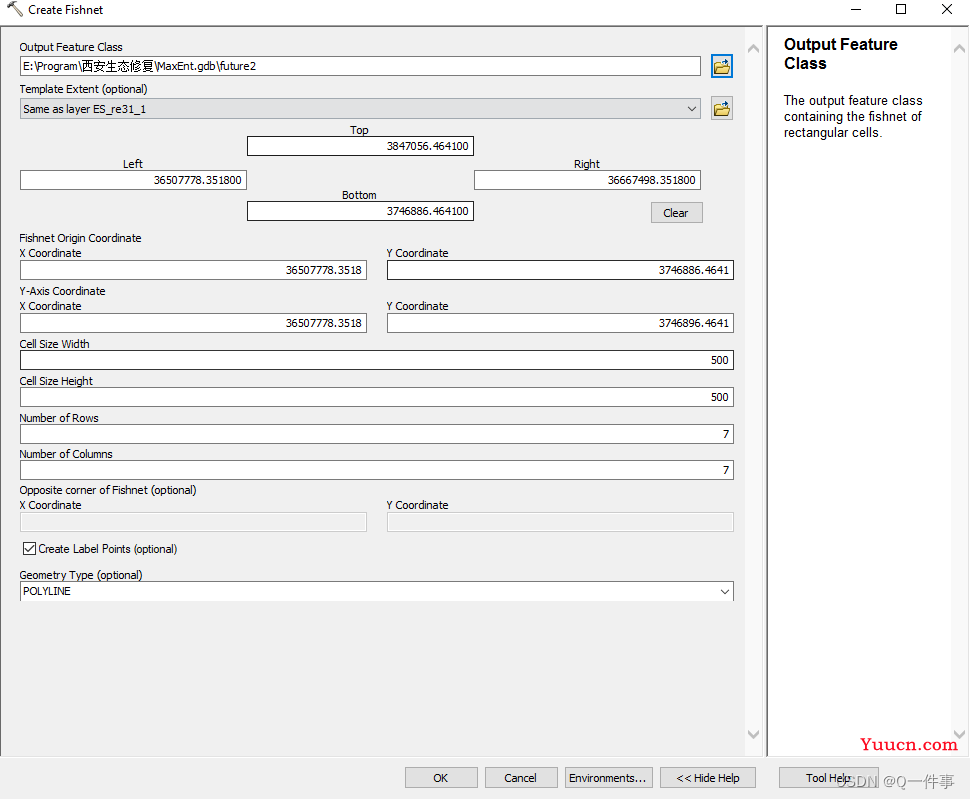
创建渔网,进行分析。
这里的渔网,随便找一个矢量确定其位置就好。
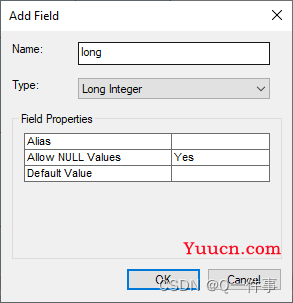
新建一个字段。
随机生成1-50的值
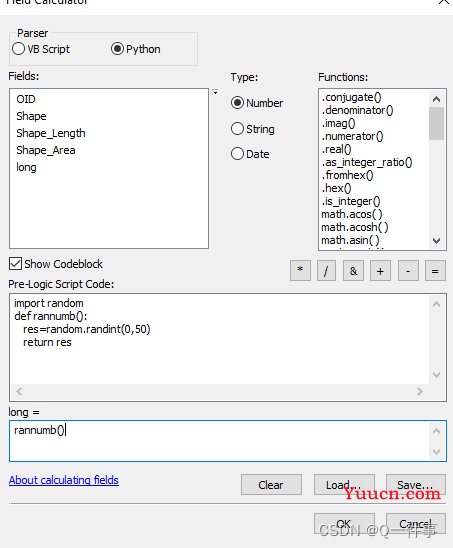
import random
def rannumb():
   res=random.randint(0,50)
   return res
转成栅格
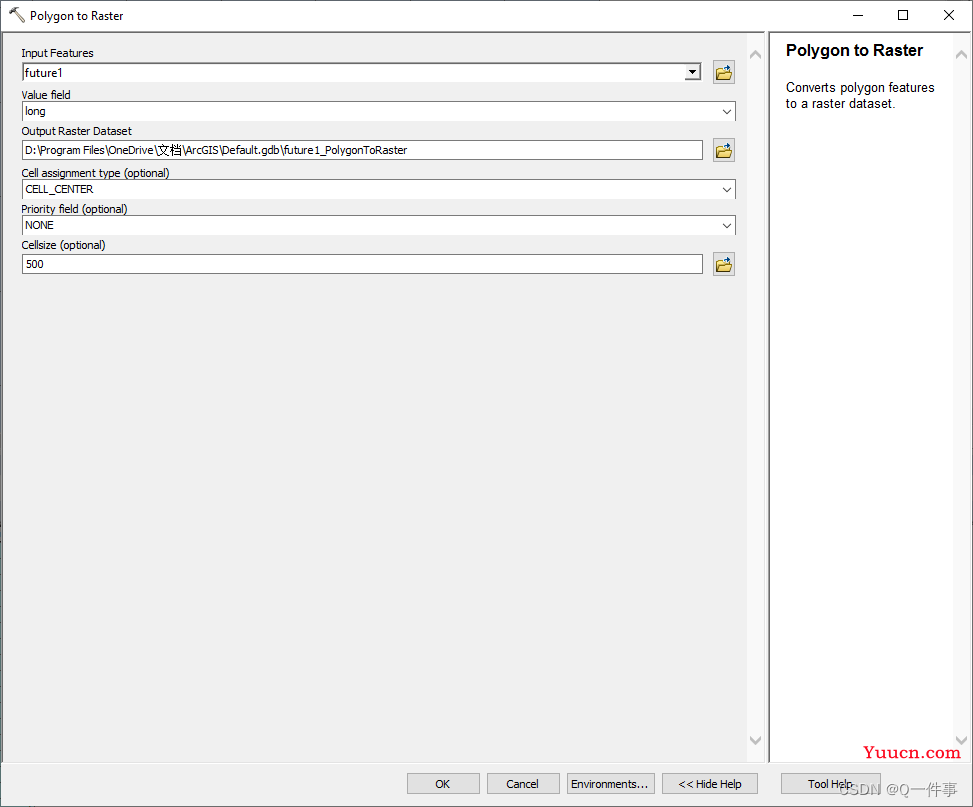
用字段计算器生成两个栅格。但是这样生成的两个栅格有相同值,在属性表中的体现为:一个值的count并非为1.
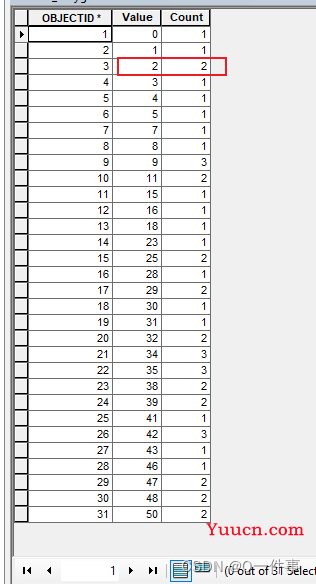
这样也因此没有49个数,为了后期方便验证,我还是把每个值设定为不同的值。
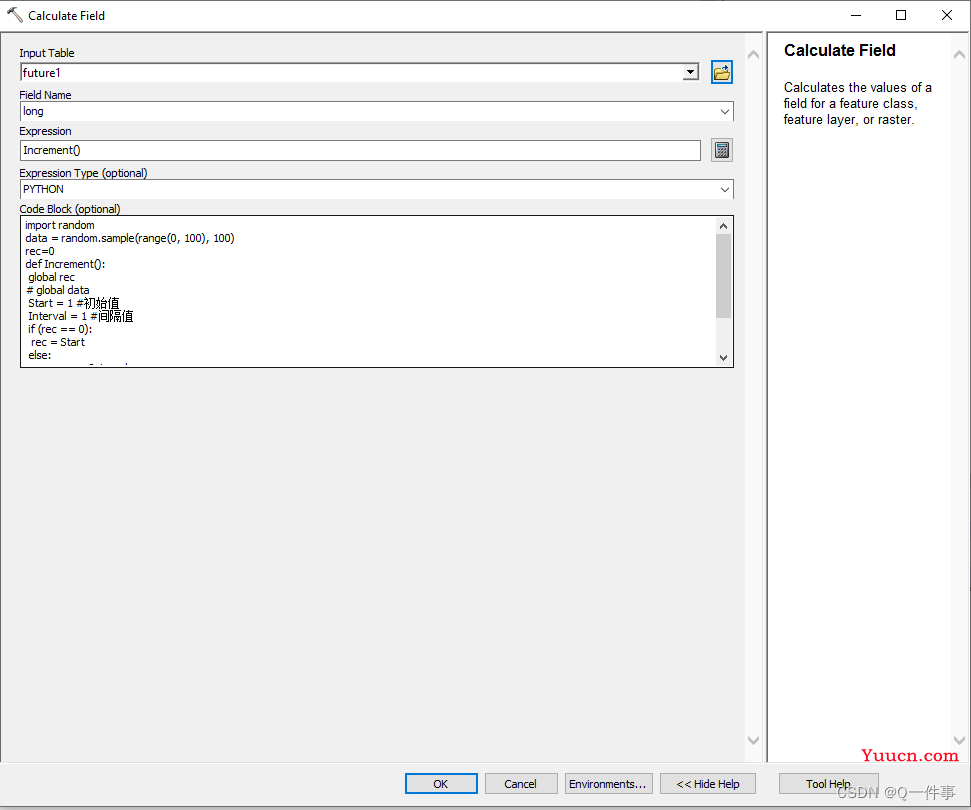
代码什么意思自己感悟,不懂的话可以在下面留言。
import random
data = random.sample(range(0, 100), 100)
rec=0
def Increment():
 global rec
 global data
 Start = 1 #初始值
 Interval = 1 #间隔值
 if (rec == 0):
  rec = Start
 else:
  rec = rec + Interval
 data_rec=data[rec]
 return data_rec
直接计算。
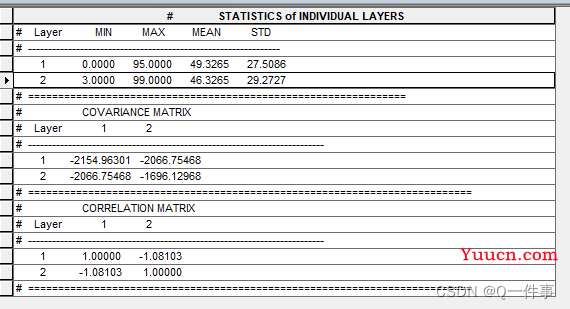
在属性表中统计的和用Band Collection Statistic计算的比较,最大最小值和平均值是一样的,但是标准差是不一样的。
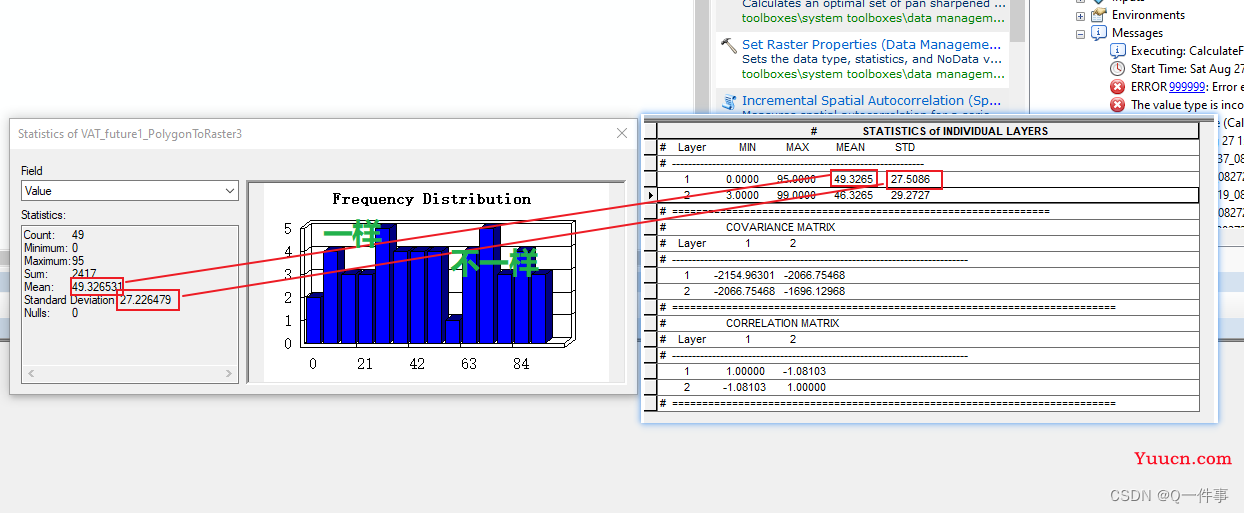
再用excel验证一下。即在excel中计算一下标准差。这两个是不同的标准差。

再看一下协方差,这里的协方差是计算两个相同的数的。乍一看好像和上面Band Collection Statistic计算的没有什么关系。看来还是要看两个,不同变量的协方差来看关系。

之前我忘记弄记录两个栅格的位置对应关系了。所以我根据上面的方法新建两个图层。
位置对应关系。
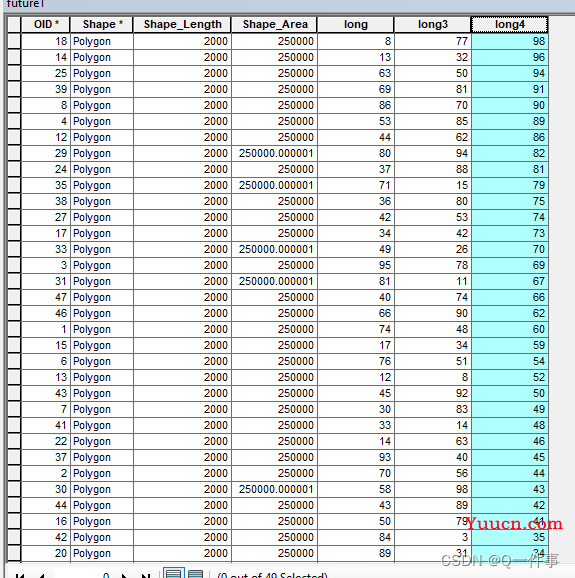
新建的long3和long4的关系。
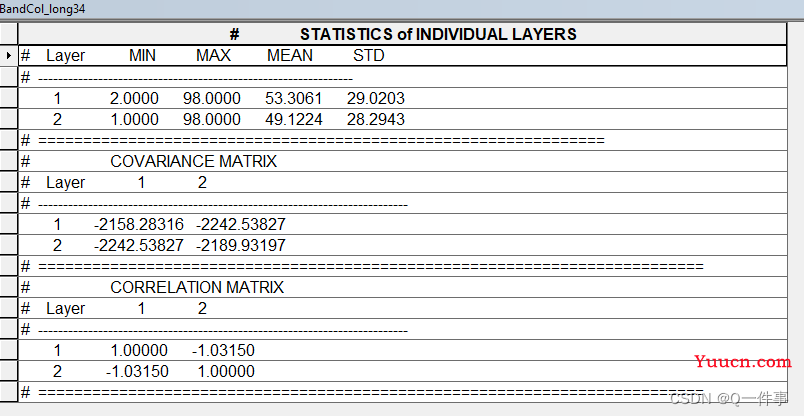
于是导出两个表格计算协方差。好像也是不对的,这里说的协方差那么我们就不能确定了。
![]()
再算算相关性吧,无容置疑,-1.01315的相关性本身就超出了相关性的值域。这是在excel里面算出的相关性。这个更有可能。
![]()
总结:ArcGIS来算相关性是不合适的。
参考文献
论ArcGIS10.2的Band Collection Statistics工具计算相关系数的正确性
支撑数据
数据下载