在实际的项目开发中,我们通常会用到Echarts来对数据进行展示,有时候需要用到Echarts的点击事件,增加系统的交互性,一般是点击Echarts图像的具体项来跳转路由并携带参数,当然也可以根据具体需求来做其他的业务逻辑。下面就Echarts图表的点击事件进行实现,文章省略了Echarts图的html代码,构建过程,option,适用的表格有饼图、柱状图、折线图。如果在实现过程中,遇到困难或者有更好的建议,欢迎留言。
饼图点击事件
mounted() {
     //饼状图点击事件
     myChart.on('click', (param) =>{  //这里使用箭头函数代替function,this指向VueComponent
        let index;
        //当前扇区的dataIndex
        index = param.dataIndex;
        //自己的操作,这里是点击跳转路由,并携带参数
        if (index !== undefined) {
          //myChartYData为饼图数据
          if (this.myChartYData[index].value!=0){
            /*跳转路由*/
            this.$router.push({
              path: '/project/list',
              query: {
                status: index+1,
              }
            })
          }
      }
    });
}
柱状图点击事件(折线图也可使用)
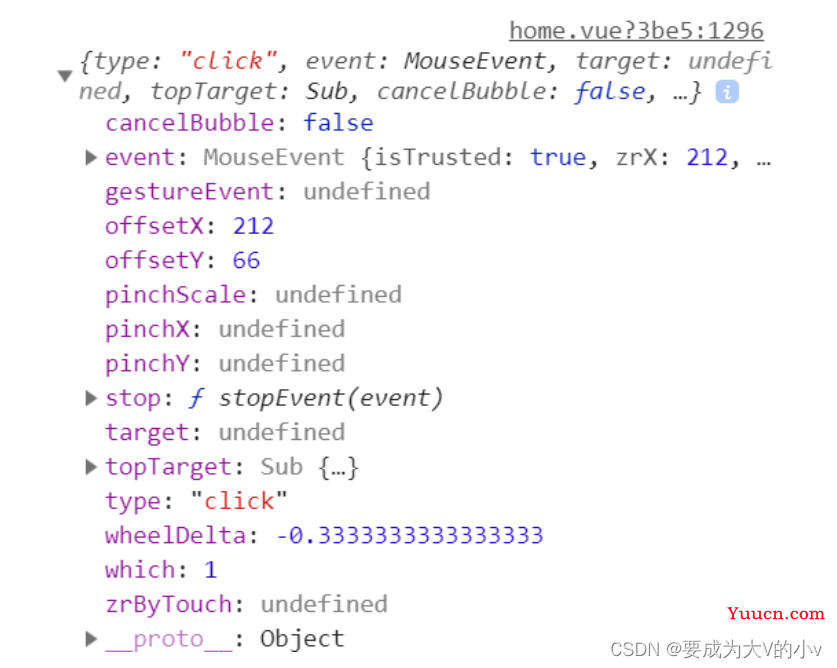
我们可以通过 myChart.getZr().on('click', ...) 来检测整个图表的点击事件,并且通过回调函数的参数来判断点击的区域,
参数params如下:

- 通过参数对象中的target属性和topTarget属性进行定位位置
- 当点击某个图形元素:target对象中有dataIndex,seriesIndex属性,即可知道点击那个图形元素。
- 当点击grid内的空白位置:target对象为undefined,topTarget不为undefined。
- 当点击坐标轴标签:topTarget对象的anid值为"label_xx", xx为坐标值。
- 当点击坐标轴外的空白位置:target对象和topTarget多为undefined。
    //柱状图点击事件
	myChart.getZr().on('click', (params) => {
      //echartsData为柱状图数据
      if (this.echartsData.deviceCode.length > 0) {
        const pointInPixel = [params.offsetX, params.offsetY];
        //点击第几个柱子
        let index;
        if (myChart.containPixel('grid', pointInPixel)) {
          index = myChart.convertFromPixel({seriesIndex: 0}, [params.offsetX, params.offsetY])[0];
        }
        if (index !== undefined) {
          /*事件处理代码书写位置*/
          var deviceMac = this.echartsData.deviceMac[index];
      		/*跳转路由*/
          this.$router.push({
            name: 'Statistics',
            params: {
              mac: deviceMac,
            }
          })
        }
      }
    });
1、使用getZr添加图表的整个canvas区域的点击事件,并获取params携带的信息:
myChart.getZr().on('click', (params) => {}
2、获取到鼠标点击位置:
const pointInPixel = [params.offsetX, params.offsetY];
3、使用containPixel API判断点击位置是否在显示图形区域,下面的例子过滤了绘制图形的网格外的点击事件,比如X、Y轴lable、空白位置等的点击事件。
if (myChart.containPixel('grid', pointInPixel)) {}
4、使用API convertFromPixel获取点击位置对应的x轴数据的索引值index,我的实现是借助于索引值获取数据,当然可以获取到其它的信息,详细请查看文档。
let index = myChart.convertFromPixel({seriesIndex: 0}, [params.offsetX, params.offsetY])[0];
其实在上一步骤中可以获取到丰富的诸如轴线、索引、ID等信息,可以在自己的事件处理代码中方便的使用。